Getting Started with iOS App Observability
Ready to add AI to your iOS apps without privacy concerns or cloud dependencies? Apple Foundation Models brings powerful on-device language models to iOS 18+. This tutorial shows you how to build AI-powered apps with structured data generation, covering basic integration and advanced techniques for production-ready features. By Ehab Amer.
When you release your app to the store and people around the world start using it, you will soon find out that there are some odd bugs people are experiencing and it’s not easy to have a full picture of what might be going wrong.
It can be easy to fix a crash from crash logs. But what if a feature isn’t working and you’re out of ideas of what could be happening and the only thing you can think of is “I wish I could debug the app on this user’s phone” which of course is rarely achievable.
In this tutorial, you’ll learn the basics of app observability, and understand how your app behaves in the hands of your customers.
Along the way, you’ll:
- Create an account of Grafana Cloud.
- Integrate Open-Telemetry Framework to your iOS app.
- Send telemetry information from your app and visualize it on Grafana.
You can learn more about App observability from the App Observability Module.
Getting Started
You’re going to start off by creating a free account on Grafana.com.
You can use Google account, Github, Microsoft or Amazon to link it directly with grafana.
Once you do so, Grafana will ask you to create a Stack which will be your own portal.
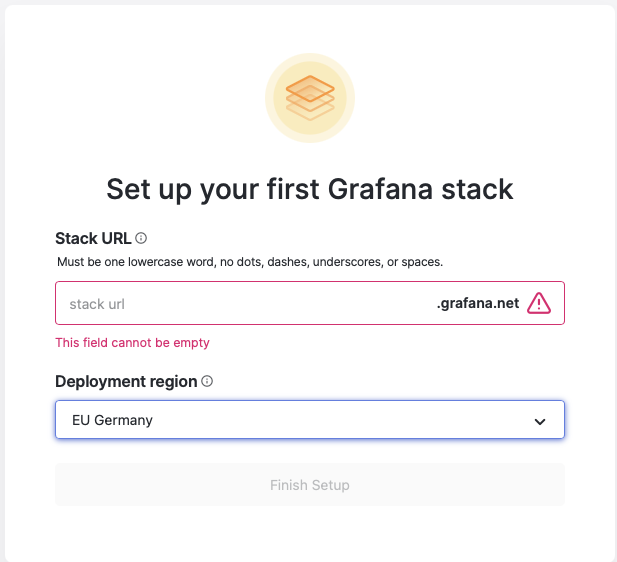
It can take a couple of minutes when you open it for the first time.
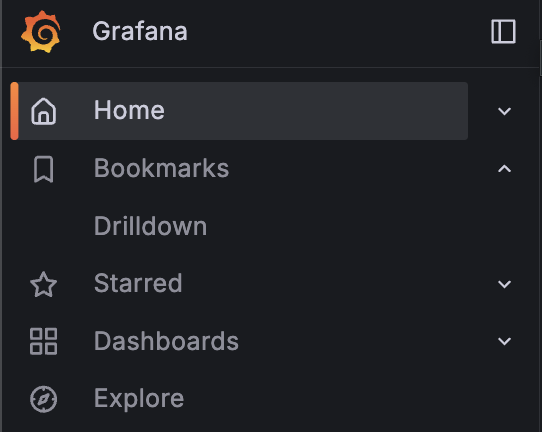
Once it’s open, go to the “Home” page from the side menu. This will take you to a Getting Started Guide page.
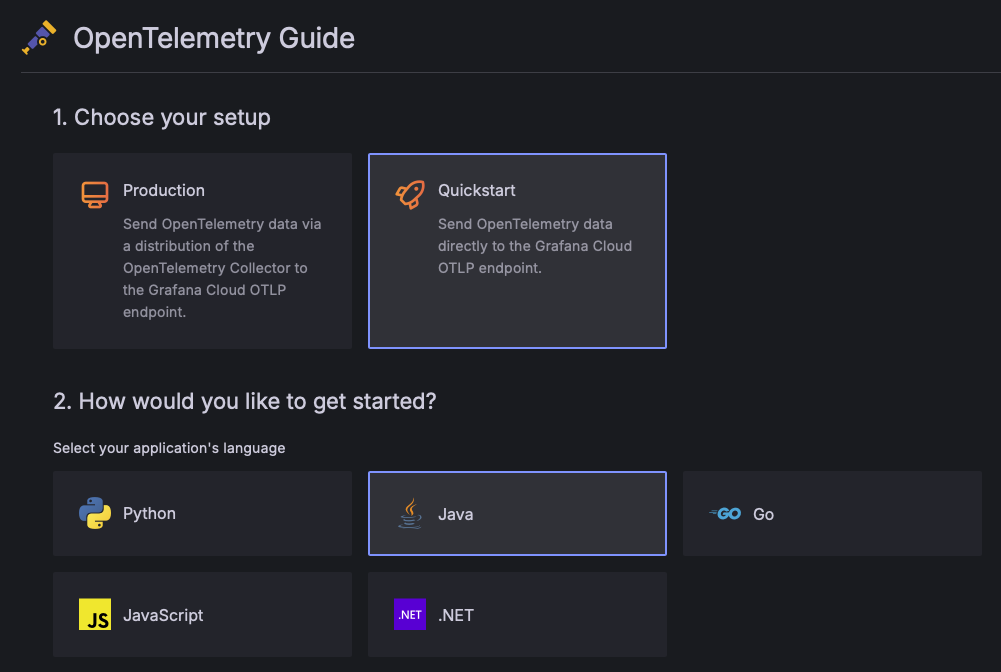
From the list of options, Choose OpenTelemetry
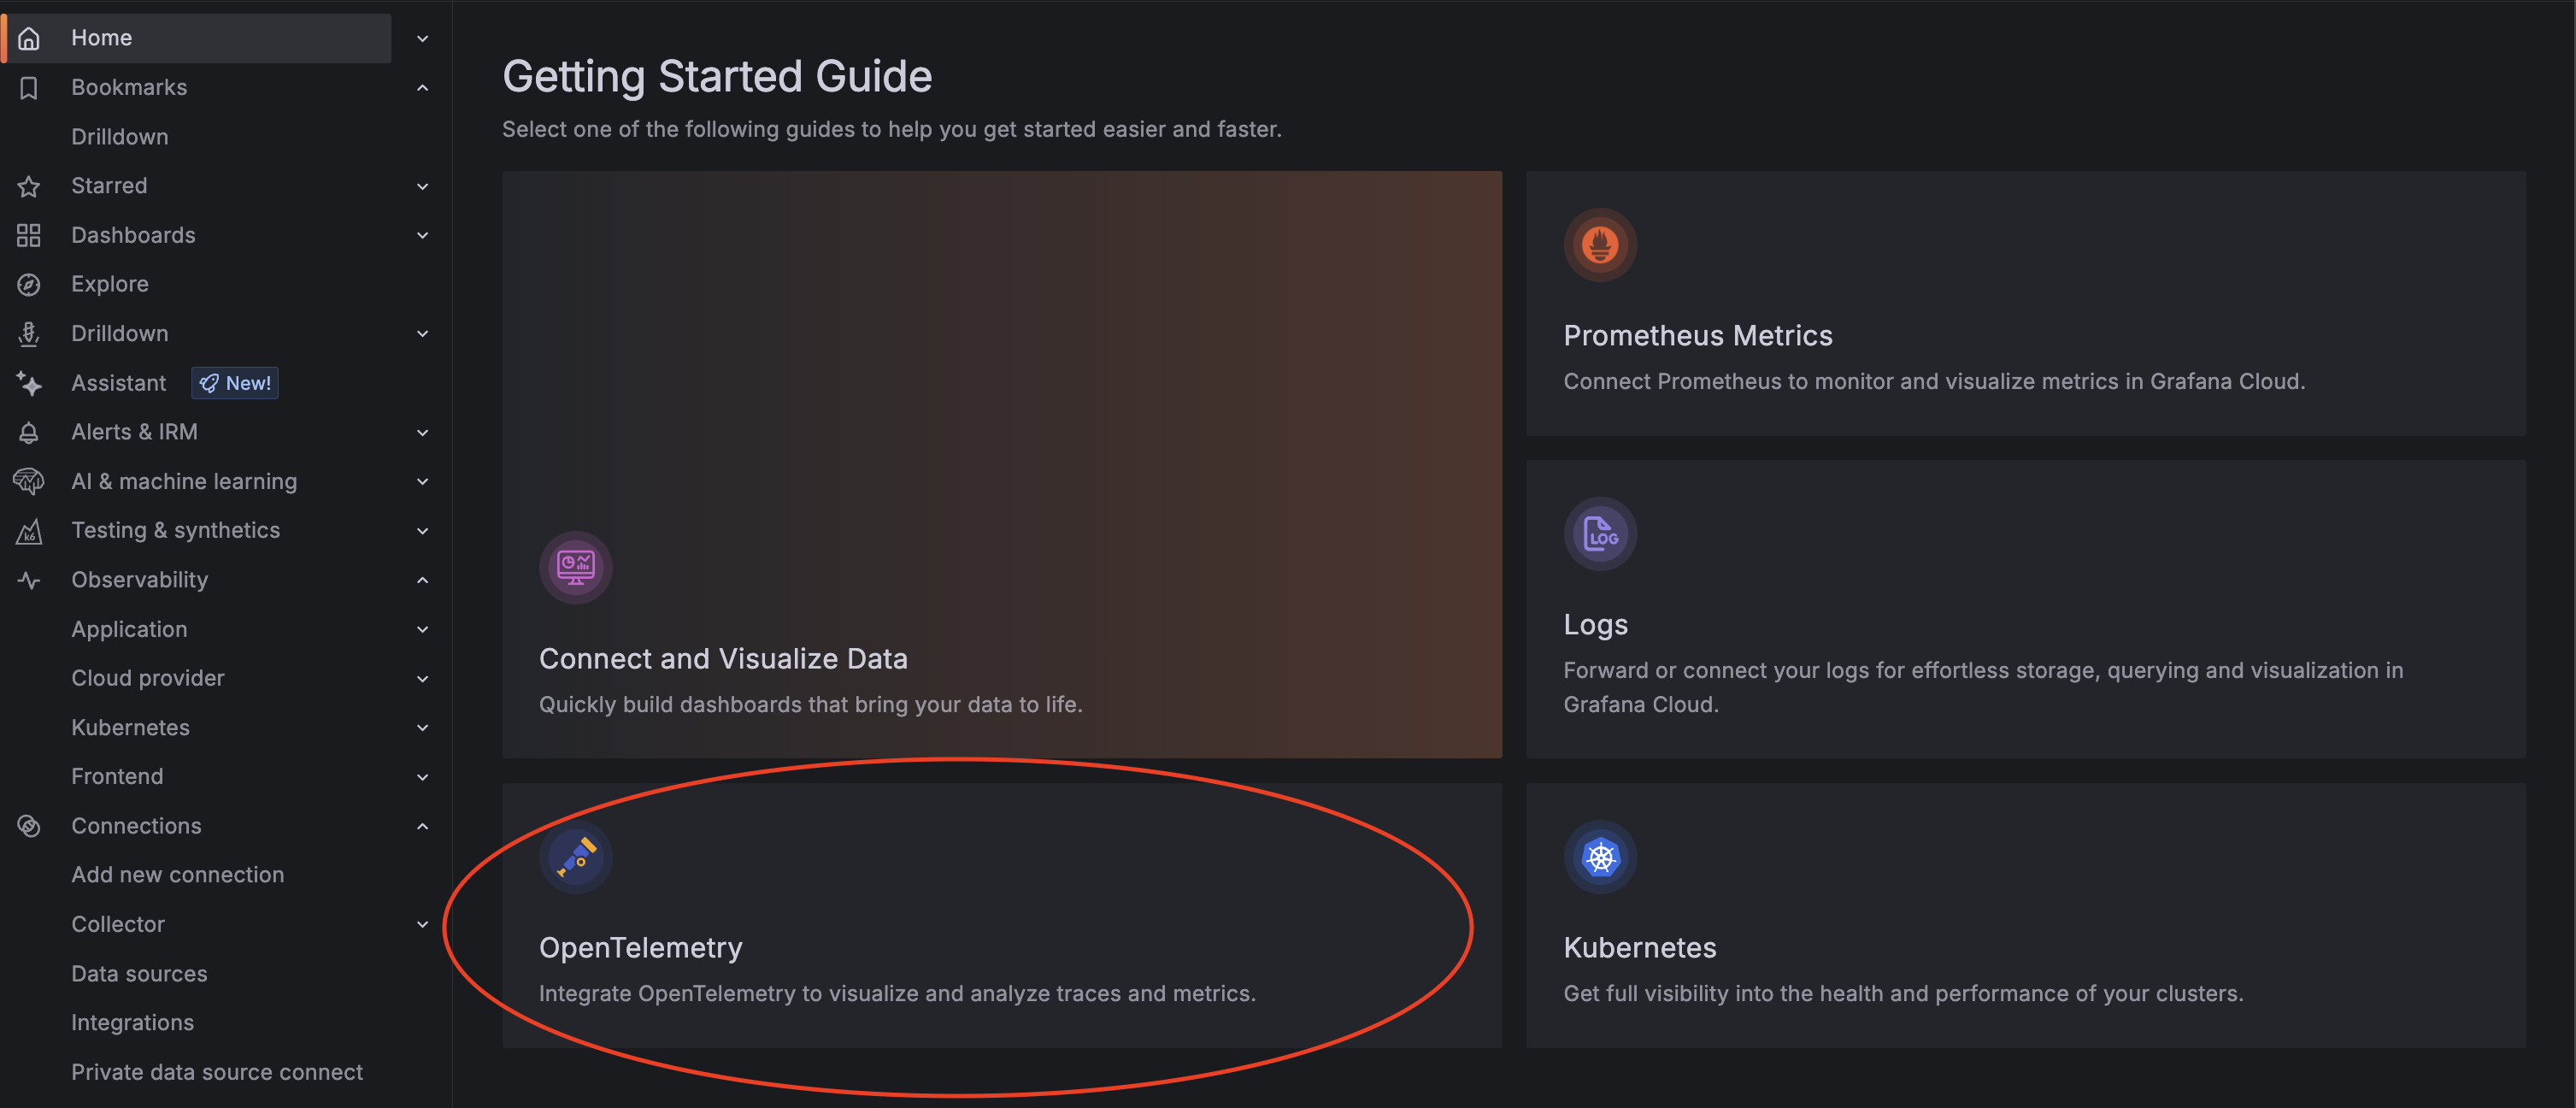
This will take you to the OpenTelemetry Guide page for OpenTelemetry integration.
Under Choose your setup select Quickstart, then select Java as an example.
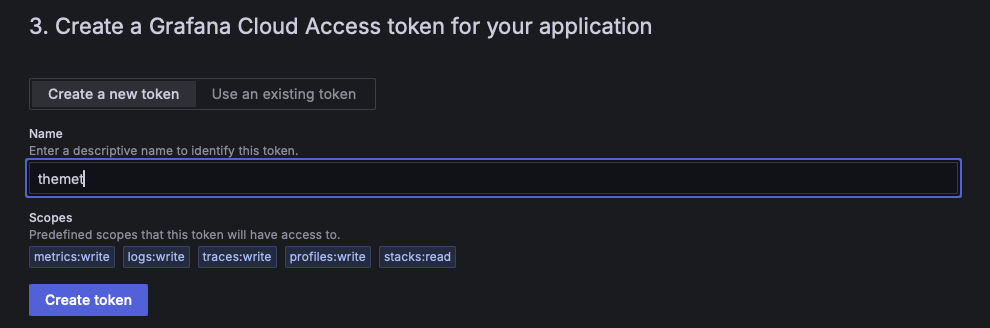
Enter the name of the app that you’ll connect to Grafana. Type themet then tap on Create token.
This will bring you to the setup you need to connect to Grafana. Under the “Add automatic instrumentation” section, you’ll need two things:
- The authentication token from the OTEL_EXPORTER_OTLP_HEADERS parameter (hidden in the screenshot).
- The URL for your Grafana stack from the OTEL_EXPORTER_OTLP_ENDPOINT parameter.
"Authentication=Basic [YOUR_TOKEN]"
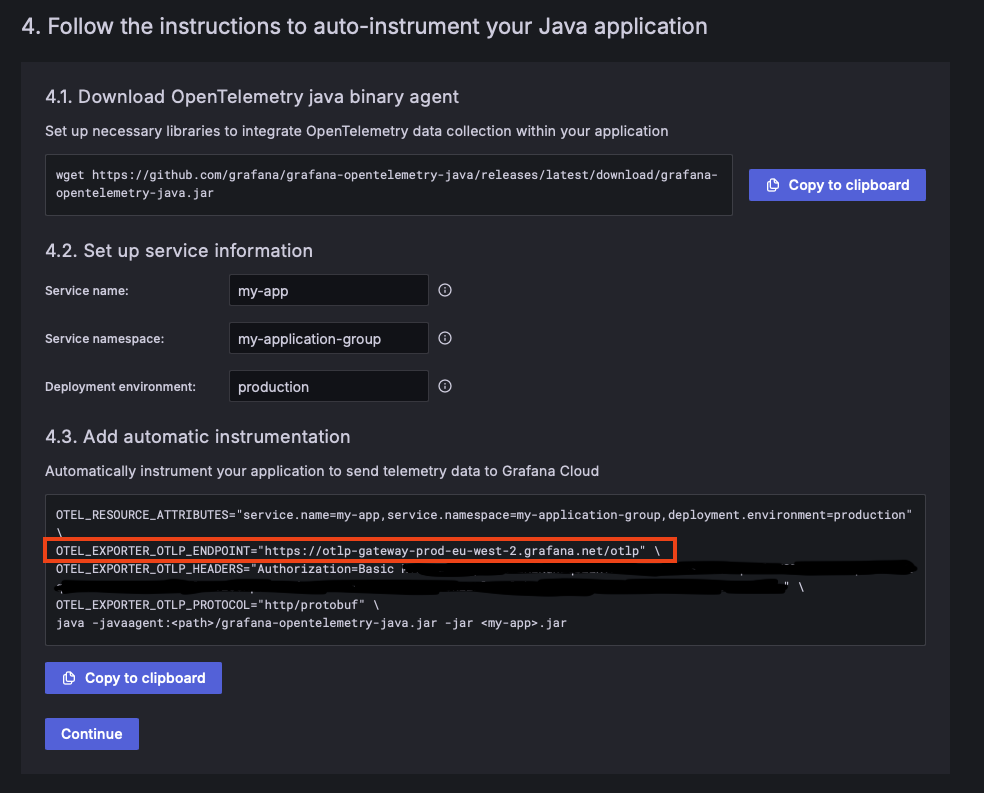
Store these values , as you’ll be using them in the whole module. Then, press the Continue button to finish. You should see a confirmation message saying “You’re all set!”.
Integrating OpenTelemetry Framework
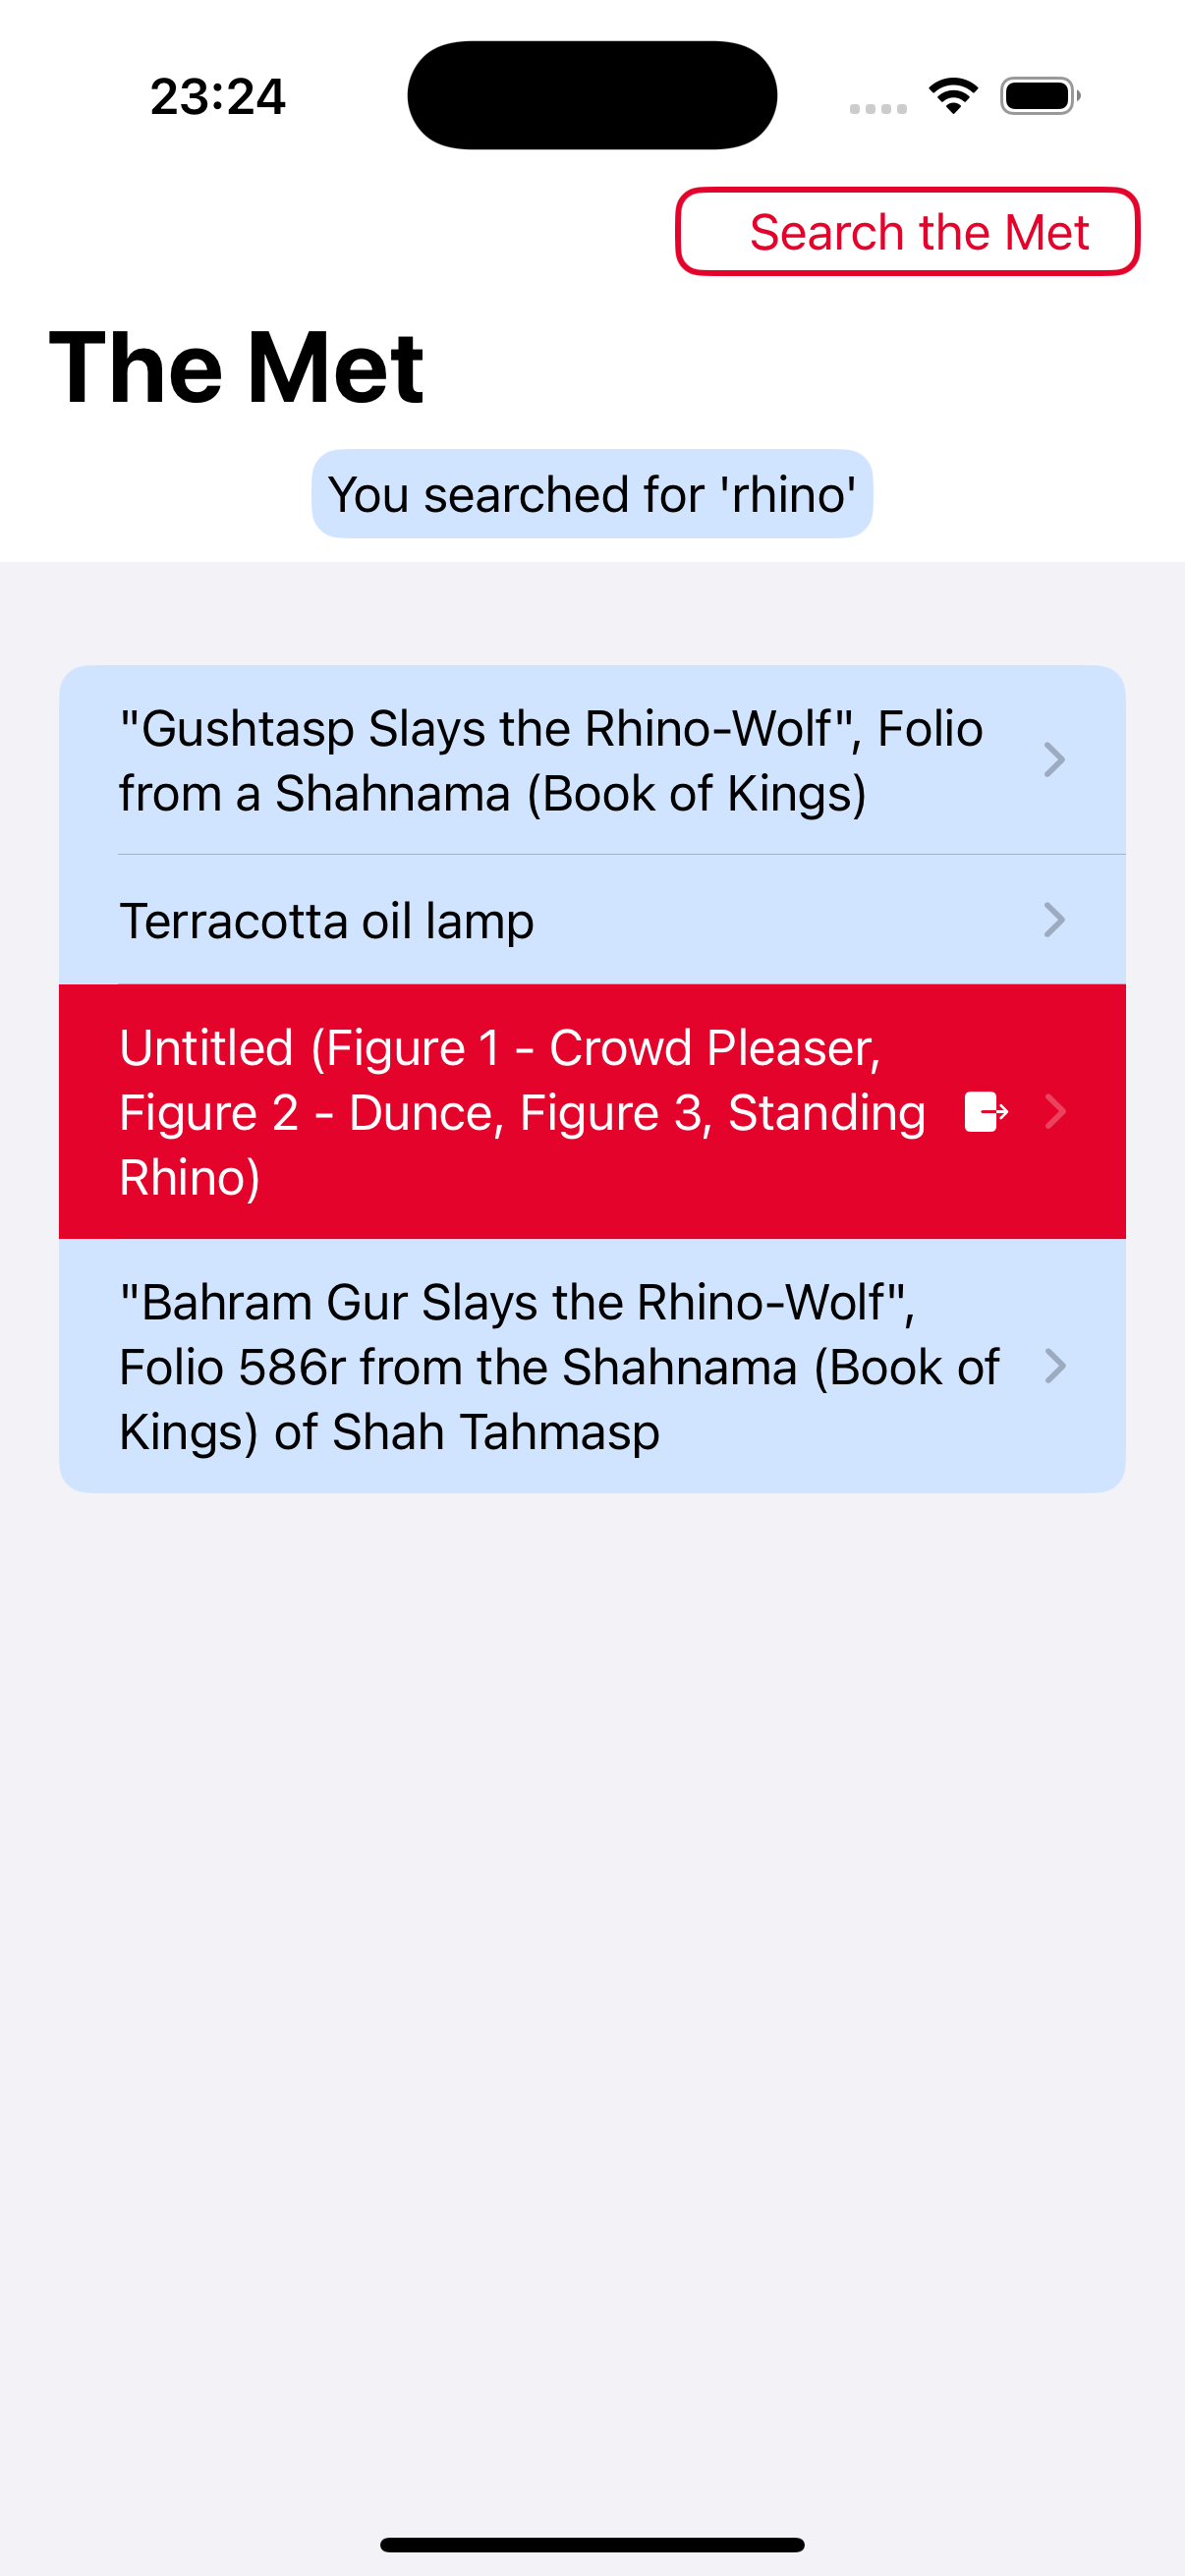
To get started, open the sample project in the starter folder. It’s a mobile app that lets you search the Metropolitan Museum of Art with any keyword and lists the results on screen.
Start by adding OpenTelemetry’s SPM package from https://github.com/open-telemetry/opentelemetry-swift.
Xcode will ask you to choose which targets to integrate in your project. Choose the following:
- OpenTelemetryApi
- OpenTelemetryProtocolExporter
- OpenTelemetryProtocolExporterHTTP
- OpenTelemetrySdk
Setting up your OpenTelemetry Tracing
In the project navigator, create a new folder under the project file and name it Observability, then create a new swift file named OTelSpans.swift in that folder. Replace the code in the new file with the following:
import Foundation
import OpenTelemetryApi // 1
import OpenTelemetrySdk
import OpenTelemetryProtocolExporterCommon
import OpenTelemetryProtocolExporterHttp
import ResourceExtension

public class OTelSpans {
  private static var shared = OTelSpans() // 2

  var grafanaHttpExporter: OtlpHttpTraceExporter! // 3
  // 4
  let grafanaToken = "" // Set your Grafana token here
  let grafanaEndpoint = "" // Set your URL here

  private init() { // 5
  }
}
- First you import the targets you added to the project through SPM.
- You’ll create a singleton instance of the class you created
OTelSpansand you’ll use the shared instance across the project. - The
OtlpHttpTraceExporteris the integration object that creates the connection between OpenTelemetry framework in your app and Grafana - Set these properties to the token and URL you copied from Grafana in the previous section. Integration won’t work without them.
- Finally, an empty private init method. You’ll be filling it in now.
Add this to the private initializer:
let grafanaEndpoint = URL(string: "\(grafanaEndpoint)/v1/traces")! // 1
let grafanaHeaders = OtlpConfiguration(headers: [("Authorization", "Basic \(grafanaToken)")],
                                       exportAsJson: true) // 2

grafanaHttpExporter = OtlpHttpTraceExporter(endpoint: grafanaEndpoint,
                                            config: grafanaHeaders) // 3

let spanProcessor = SimpleSpanProcessor(spanExporter: grafanaHttpExporter) // 4

OpenTelemetry.registerTracerProvider(tracerProvider:
                                     TracerProviderBuilder()
  .with(resource: DefaultResources().get())
  .add(spanProcessor: spanProcessor)
  .build()
) // 5
- Create a URL instance with the the Grafana server.
- Create the configuration Grafana needs to authenticate the connection against your Grafana stack that you created. Its a tuple of strings, and specified the data to be sent as JSON.
- Create an instance of
OtlpHttpTraceExporterusing the URL and the configuration. - Create a processor that will be responsible for sending the spans through your exporter. You’ll be using the simple processor for now.
- Finally, You register the trace provider through its builder. The builder can take some resources to include with every span, which are a set of key-value pairs to include in all the spans. Then pass the builder the processor you just created.
Add this method to OTelSpans right after the initializer:
internal func tracer(  // 1
  scopeName: String
) -> any Tracer {
  let instrumentationScopeVersion = "semver:0.1.0"  // 2

  let tracer = OpenTelemetry.instance.tracerProvider.get(  // 3
    instrumentationName: scopeName,
    instrumentationVersion: instrumentationScopeVersion)
  return tracer
}
- The new method takes a string as a parameter and returns an object conforming to
Tracerprotocol. To get the tracer instance, you need to specify an instrumentation name, which is the parameter passed to the method, and a version which you’re setting as a constant. The “semver” is short for Semantic Version.
- Finally, you get the tracer object from OpenTelemetry and return it.
Now to add a method to create a span, add the following after the last method at the end of the class:
public func createSpan(  // 1
  scopeName: String,
  name: String
) -> (any Span) {
  var spanBuilder = tracer(scopeName: scopeName)  // 2
    .spanBuilder(spanName: name)

  let span = spanBuilder.startSpan()  // 3

  return span
}
- The method takes two string parameters, once for the scope name that you’ll use to get a tracer, the second is the name of the span.
- Using
tracer(scopeName: String)method you created earlier, you get the tracer and through it a span builder while defining a name for any span created from this builder. - From the builder, get a span that is already started. Starting the span is equivalent to setting the start date to
Date.now.
Since OTelSpans is keeping the shared property and the initializer private, it would make the usage of your feature easy by making a class method that forwards the call to its own internal instance. Add this method:
public class func createSpan(
  scopeName: String,
  name: String
) -> (any Span) {
  shared.createSpan(
    scopeName: scopeName,
    name: name)
}